
Back to Blog
Now more than ever, businesses face a sea of data points that can make drawing insights time-consuming at best and nearly impossible at worst. Financial dashboards are critical for assessing performance and making educated decisions, closing more sales, and reducing customer acquisition costs.
The right accounting dashboard gives finance teams the power to spot trends, opportunities, and growing problems, and effortlessly visualize large datasets. With easy-to-parse graphical representations, you can deliver crisp, concise C-suite presentations, and quickly analyze business performance, operational statistics, and sales metrics with very little effort.
Never miss a new resource!
Newsletter sign up
"*" indicates required fields
With the right accounting dashboards in place, you’ll see revenue, costs, profit, loss, and all your other guiding stars laid out at your fingertips. Scroll down for the best financial dashboard examples for your business, plus tips to customize financial dashboards to fit your processes and accounting workflows.
What is an Accounting Dashboard?
A financial accounting dashboard is a digital tool for business intelligence. The best financial dashboards let accounting and finance professionals save time by tracking key KPIs, reducing massive, real-time data sets down to vital insights at a glance, and customizing reports for instant, robust financial understanding.
Top Accounting Dashboard Features to Look For
The best accounting dashboard solutions help finance teams move beyond static spreadsheets and manual reporting by delivering real-time financial visibility and actionable insights. Top accounting dashboard features often include customizable reporting, KPI tracking, automation, forecasting tools, and centralized financial data.
A modern accounting software dashboard should make it easier to monitor profitability, cash flow, expenses, receivables, payables, and operational performance from one centralized location. Features like drill-down reporting and customizable dashboard views also help finance teams quickly identify trends, uncover issues, and make more informed business decisions.
Modern accounting dashboard solutions also help support broader accounting automation initiatives by reducing manual reporting processes and improving operational efficiency. Combined with AI-powered tools and accounting AI agents, finance teams can automate workflows, surface real-time insights faster, and spend less time gathering data manually.
How Can Accounting Dashboards Help Make Business Decisions?
With the right financial reporting dashboards in place — such as revenue dashboards or general ledger dashboards — CFOs and their teams can track business-driving KPIs in real time. This up-to-the-minute tracking makes it easier to respond to changes in the business environment and take advantage of emerging opportunities.
For example, a custom accounting dashboard that shows billing aging by customer can make it easy to automate follow-ups on overdue bills and improve cash flow. A project-net-profit dashboard helps to highlight the profitability of each active project. That added clarity can spotlight the projects that deserve more resources and the ones that need attention.
As businesses manage larger volumes of financial data, many finance teams are moving away from static spreadsheets and manual reporting methods in favor of more dynamic accounting dashboards.
Accounting Dashboards vs Traditional Financial Reporting
Traditional financial reporting often relies on static spreadsheets and manual processes that can quickly become outdated. A modern financial accounting dashboard gives finance teams real-time visibility into business performance, helping organizations make faster and more informed decisions.
Unlike traditional reports that may require hours of manual updates to financial reporting and analysis, accounting dashboards consolidate financial data into one centralized view. This allows finance teams to quickly monitor KPIs, identify trends, improve forecasting, and respond to changes in real time.
The following accounting dashboard examples highlight some of the most valuable ways finance teams can track performance, improve visibility, and support better business decisions in real time.
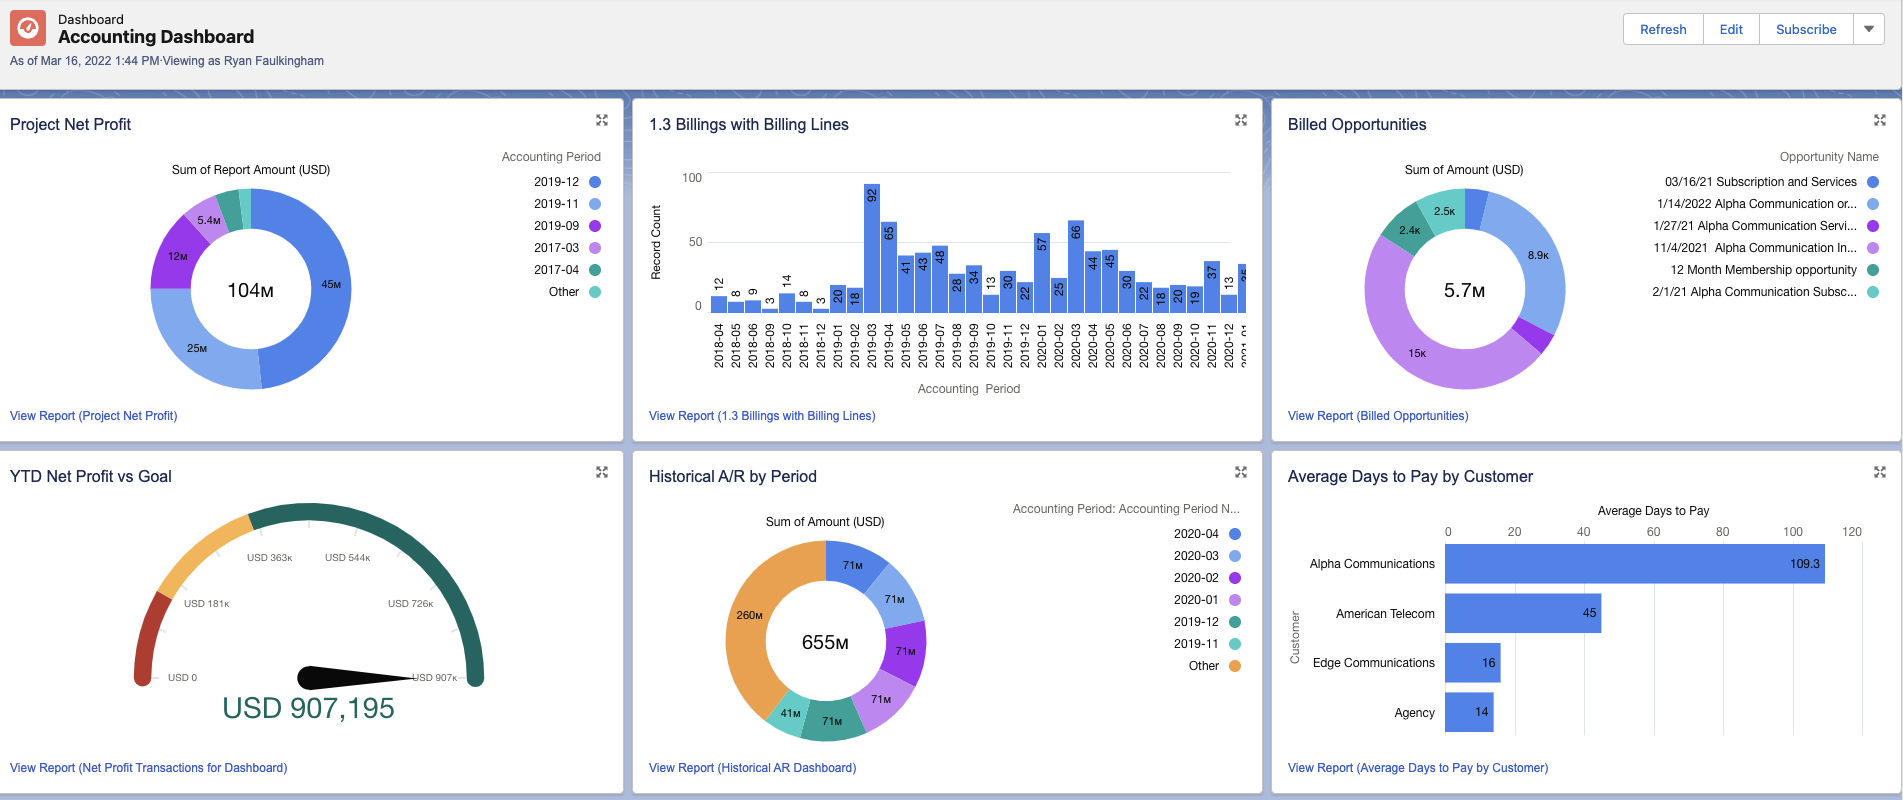
1. Project Net Profit
What’s your most profitable project? Your business will go from good to great with a top-line view of total profit, broken out by project. See your star performers and your laggards in one game-changing graphical view. Then click through for details to gain insights that can help your teams expand on and learn from your successes.
2. Net Profit vs Goal
What gets measured gets improved. A year-to-date net profit vs goal display shows where you are vs where you hoped you’d be. A full-color, easy-to-read speedometer-type gauge displays your progress as a function of revenue and costs. This is one of the best financial dashboards for CFOs to monitor overall performance.
3. Average Days to Pay By Customer
Who pays promptly and who doesn’t? When you know your average days to pay by customer, you can make smarter decisions about support and service. This useful accounting dashboard lets you flag high-risk clients and spotlight clients who deserve special attention. Choose the current age or a historical view to track changes, too.
For more information about this topic, explore the guide to the Best Vendor Payment Processes.
4. Profit & Loss
A real-time profit-and-loss dashboard shows net profits in real time and delivers on-demand projections for sales and expense. See the financial health of your business for any given month, quarter, year, or other period, to unearth opportunities to cut costs and drive revenue. Easily spot expense and revenue trends and get a handle on net income, and cash flow, without spending hours on manual reporting.
5. Billing Age By Customer
Following up on unpaid invoices is a common best practice for improving cash flows. Tracking billing age by customer can help boost your company’s liquidity. This is the best financial dashboard example to track overdue receivables and surface customers who need more attention from your team.
6. Expense By Location
Which locations in your company cost the most by month, quarter, or year? See a clear graphical view of the different areas of your business by expense. This finance dashboard lets you identify more and less profitable locations and departments. It can also help you allocate resources more efficiently and build a robust understanding of your expense reports.
7. Available Inventory
Knowing what’s on hand down to the second can help you spot anomalies and errors, flag sales increases, and stay on top of unexpected expenses. When you uncover these issues early, you can address them before they cause serious problems in your business. Inventory tracking without a simple dashboard like the one in this example can be prohibitively time consuming, especially as your company grows.
8. Forecasted Revenue
This forecast financial dashboard example can inform your team about the right steps to take to scale or right-size your business. The more data you put into the system for past and projected expenses and earnings, the more accurate the model is. Revenue forecast dashboards like this can also help you dial in your cash flow management.
9. Forecasted Payables
Along with projected revenue, accounting dashboards that predict your future payables can help you understand your company’s current bandwidth. With this forecasted payables dashboard, you’ll get an easy way to fine-tune payment patterns, bolster vendor relationships, and lock down your working capital ratio.
10. Revenue vs Goal
Nothing motivates like real-time revenue metrics, especially when balanced against company objectives. This easy-to-parse financial dashboard example shows your goal, your current situation, and your performance in a simple gauge. Drill down for more detail and create insight-driving reports.
11. Net Value of Fixed Assets
The net value of fixed assets metric lets you make better decisions about how to use your long-term assets. This financial dashboard template reveals asset value, now and historically, along with depreciation. It can help your team make better decisions about when to modernize your assets or when to replace them, or repurpose them.
12. Transaction Detail by GL Account
Finding transaction detail in a complex chart of accounts can quickly become challenging. This useful general ledger dashboard lets you filter by specific GL accounts like revenue, expenses, or transfers. You can also zoom in for more granularity by period and see transaction details. Spot transaction origins and contact points for smoother reconciliations and less time searching for key information.
13. Expiring Payment Methods
When a customer’s payment method expires, an automatic charge creates headaches for both the customer and your business. This corporate finance dashboard lets you view credit cards that are expiring soon. This is the best financial dashboard example for avoiding declined payments from your customers and cutting down on time spent updating old payment methods.
14. Billings By Period
Sales teams and CFOs track billings by accounting period to get a sense of overall workflow and A/R trends. Following billings by month or quarter reveals the company’s growth, declines, or seasonal shifts. Tracking billings by year can highlight deeper work volume trends and opportunities for new development.
15. Current Cash Balances
What is your company’s current cash flow health? That’s not a difficult figure to find, but pulling together all the balances from multiple accounts can use up time best spent on higher-order tasks. See your current cash balances from all accounts in one financial dashboard, then drill down for more detail.
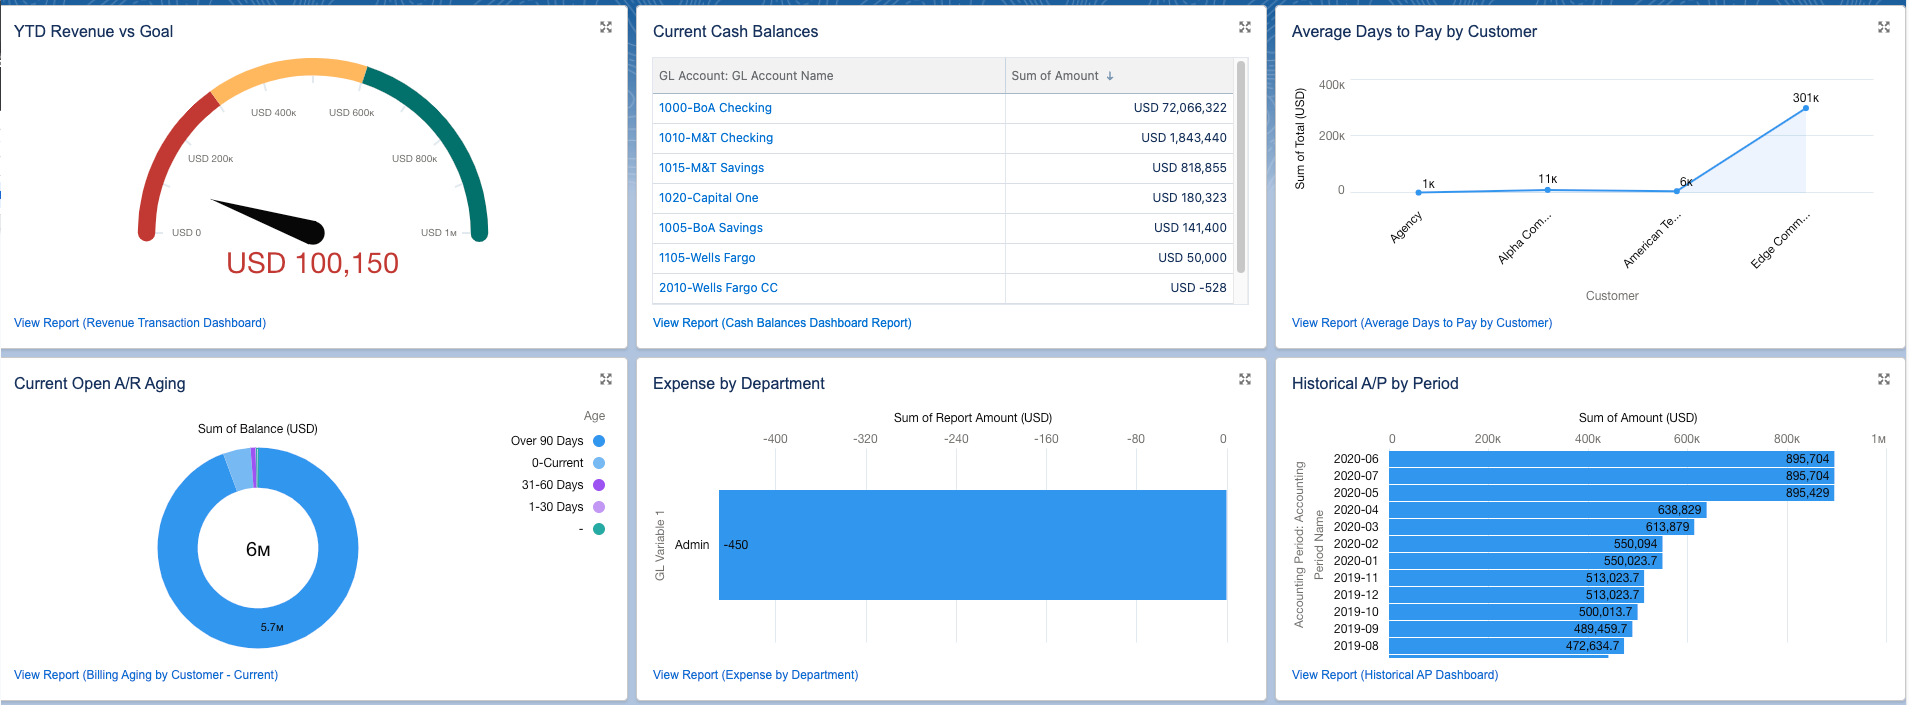
16. Payables Aging
You can significantly improve your cash flow by tracking the age of all your payables. This payables aging finance dashboard example surfaces pending and overdue payments. It can also help you cut costs by lowering your interest payments as you take advantage of low-interest or no-interest payment dates. You can choose from current or historical views to track improvements and gain insights into managing your payables map.
17. Payables By Period
Tracking payables by period can provide a clearer understanding of the volume of work your business does. It can also create a yardstick to make it easier to track other accounting metrics. See all payables by month, quarter, year, or filter by net amount. Viewing payables by year can help your team identify cost trends and give a clearer picture of business growth over time.
18. Billing Opportunities
See all opportunities for the current period that haven’t yet been billed. You can also use this accounting dashboard to view the opportunities that have already been closed. A clear, at-a-glance picture of your open billing items will help give you a firmer grasp on your company’s cash flow.
19. Cash Disbursements By Batch
If your business records more disbursements than revenues, you may be headed for financial challenges. Tracking cash disbursals can give you time to react to potential cash flow troubles. This is among the best financial dashboard examples to closely monitor your operating costs and gain key insights into your general ledger.
20. Time Card Dashboards
View time cards by employees and by time card period, or see time card data for actual vs budget by project and project task. This is the top financial dashboard for gaining insights into which tasks and projects operate efficiently, and which are over-budget in their use of labor hours.
While the right accounting dashboard will vary depending on business needs and reporting priorities, there are several core financial metrics and KPIs that most finance teams should consistently monitor.
Important Metrics Every Accounting Dashboard Should Track
An effective accounting dashboard should help finance teams monitor the financial metrics and KPIs that most impact business performance. Tracking the right data in real time can improve forecasting, operational visibility, and overall financial decision-making.
Common metrics tracked within an accounting software dashboard include cash flow, profitability, revenue trends, accounts payable, accounts receivable, billing aging, forecasting, expenses, and budget vs actual performance. A financial accounting dashboard can also help businesses identify operational inefficiencies, improve reporting accuracy, and better understand overall financial health.
Can I Create Custom Financial Dashboards?
You can create your own financial dashboards with high-performance accounting software like Accounting Seed. Custom dashboards let you fit your reports and insights to your particular business process, shedding light on accounting and order management, sales, support, and operations.
How to Build a Custom Dashboard
With Accounting Seed’s simple drag-and-drop functionality and no-code customization, you’ll easily tailor financial dashboards to your processes and accounting workflows. Dig deeper and build crisp, clear financial presentations and real-time reports with user-defined calculations, rows, and columns.
Simply drag and drop from a massive library of built-in graphics and other dashboard elements to create custom dashboard views that fit your business.
Choosing the Right Accounting Dashboard for Your Business
If you’re ready to see through to the heart of your business operations and functions in insight-packed detail, it’s time to switch to Accounting Seed. Request a demo to learn how you can transform your business, free up valuable time, and increase your profitability.
For more helpful financial and accounting resources for your business, read on:
- Top 7 Issues Accountants Face Today
- Accounting Cybersecurity: How to Keep Financial Data Safe and Secure
- DCAA Compliant Accounting Software: What to Look For
- What are the International Accounting Standards (IAS)?
- Top 8 Reasons Why IT Implementations Fail
- What is Cash Disbursement in Accounting?
- Accrued Expenses: What Are They and How to Report Them?
- Intro to Accounts Payable and Purchase Order Accounting
A native Salesforce accounting app, Accounting Seed, provides a full 360-degree view of your business’ performance to help you and your team make the best decisions possible. Not on Salesforce? Our software can be customized to work with any system you have through a reliable connection.
See Accounting Seed in action
See how accounting on Salesforce can eliminate the need for costly integrations—and silos of mismatched information—by sharing the same database as your CRM.