
Back to Blog
Having all your customer and sales data in a single platform like Salesforce saves time and provides exceptional business clarity. But sometimes getting meaningful insights out of Salesforce can be frustrating! Read on to find out more about how Salesforce joined reports can help you better analyze your CRM data.
What Are Salesforce Joined Reports?
In Salesforce, joined reports are groupings of report “blocks” that create useful multiple views of your data. Each joined report can contain up to five report blocks. Each block contains customizable data, including summaries, and custom formulas, with data sorted by the filters of your choice.
Joined reports are particularly useful for summarizing large amounts of data, held across objects, very quickly.
Salesforce Joined Reports Example
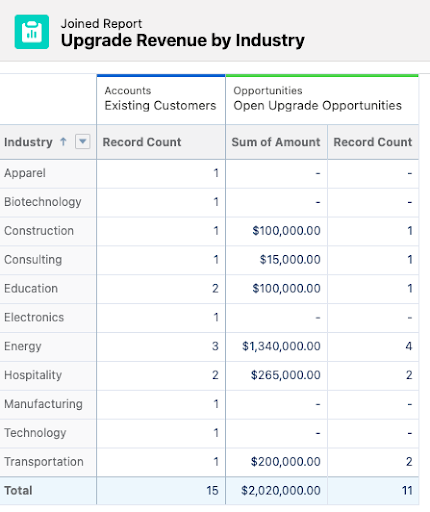
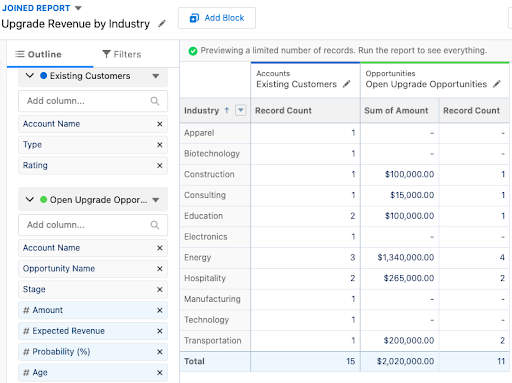
Let’s say you’re in the Sales Operations team and you want to understand which industries across your existing customer base are driving the most pipeline. Salesforce joined reports let you aggregate your total customer base and the total revenue from your upgrade opportunities in a single view.
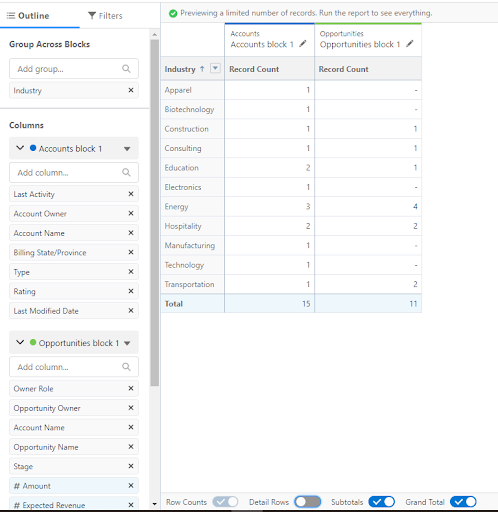
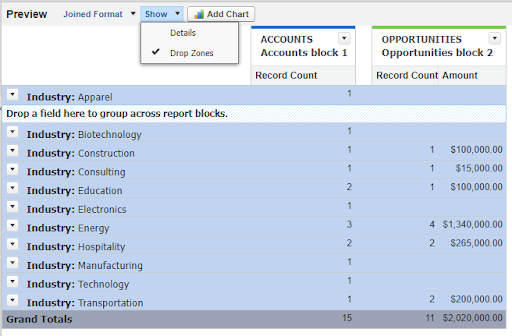
In the example data below, you can see that there are fifteen existing customers, spread across eleven industries. There are eleven “upgrade” opportunities in the pipeline, but there are five industries where existing customers don’t have any active pipeline logged against them.
It’s also evident which industries are bringing in more incremental revenue than others. In this case, the energy industry accounts for 20% of the total customer base, but more than 50% of the pipeline.
Salesforce joined reports are also useful in situations where the relationship between a record is one to many (1:n). For instance, between Accounts and Opportunities, Opportunities and Cases, or Accounts and Contacts.
How to Set Up a Salesforce Joined Report
Most Salesforce users already have experience setting up standard reports and dashboards, but you might have less experience setting up joined reports. As with standard reports, you can add joined reports to new and existing dashboards. Doing this gives valuable insight in an easy-to-view format.
Below, we’ll cover how to build a joined report in both Salesforce Lightning and Salesforce Classic.
- Start a new report
- Switch to Joined Report
- Add blocks
- Filter each block
- Group across blocks
- Summarize numeric fields
- Add a chart (optional)
Salesforce Lightning
To create a Salesforce joined report in Lightning, start by creating a new report and selecting your report type. The first report type you select will be your primary report type.
Initial Setup
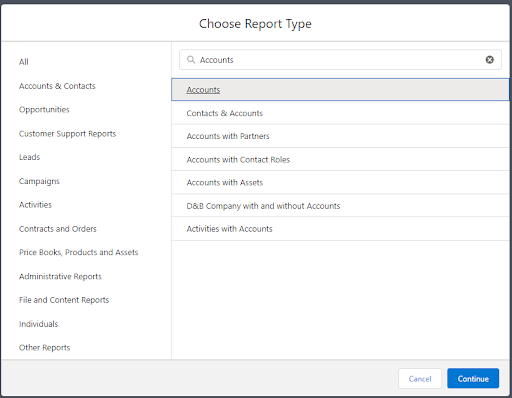
We’ll start by building the example from above. Select Accounts as the report type and click Continue.
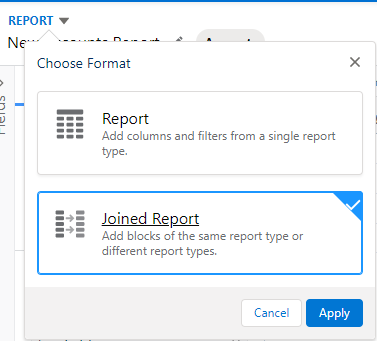
Once the report loads, you’ll notice a drop-down arrow next to Report in the upper left-hand corner. Click the drop-down arrow to switch the format to a Salesforce joined report.
The page will look the same, except you’ll notice there’s now the option to Add Block along the top of the report. Click this to add a new report type.
Adding Blocks
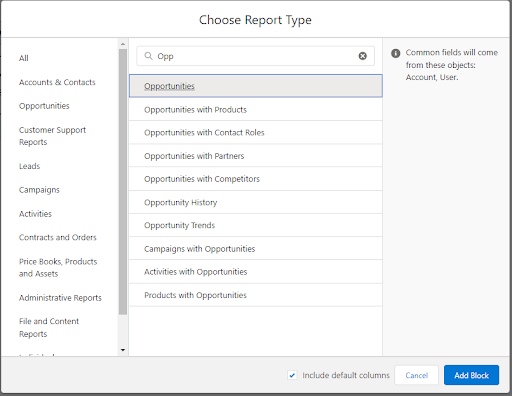
When adding a new block, the system will let you know what objects common fields are available from. In this case, we want to group upgrade opportunities by the Industry field. This is on the Account object, so you can choose this report type as the second block.
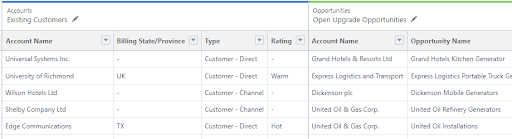
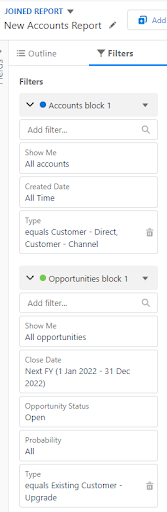
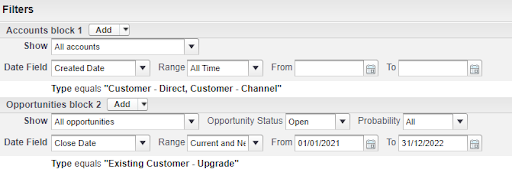
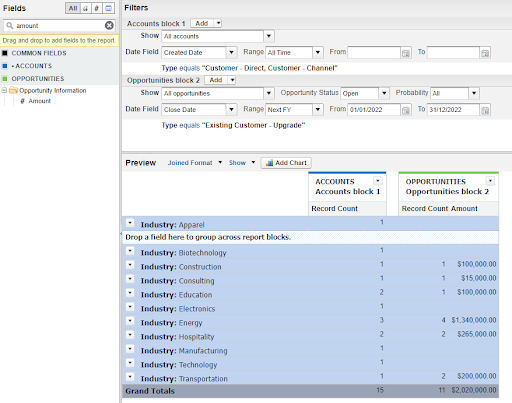
Once both blocks are added, you’ll see a list of information in each block. You can filter this data to home in on the right insights. Below, we’ve added some filters to ensure the report displays existing customers and opportunities of a specific type.
Adding Groups
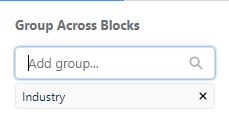
The next step is to add a group to your report, to start analyzing your data. Click back to the Outline tab after you finish adding filters, and add a field to group the data by. In our Salesforce joined reports use case, we want to group by Industry.
Once you’ve added the group, remove detail rows to get an overview of the data.
Adding Revenue
The next step is to summarize the Amount field to understand how much revenue is coming from each industry.
Click on the # Amount on the left side of the screen and a few options will appear. Choose Sum and click Apply.
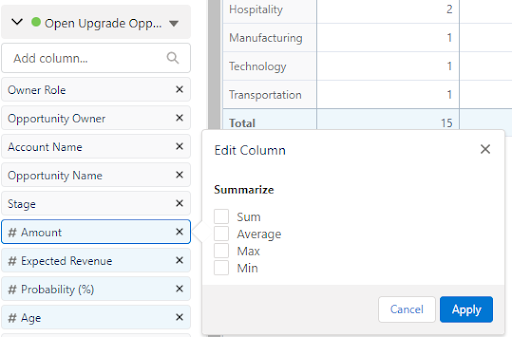
The summarized column will be added to your report.
Finalizing
You should now Save & Run your Salesforce Lightning joined report. Give your report a descriptive name so it’s clear what info the report displays.

Data Visualizations
Next, add a chart to help visualize the data at a glance.
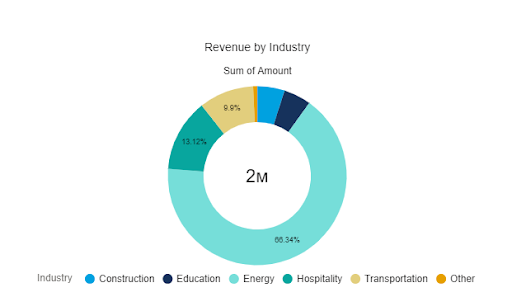
Click Add Chart, and the system will add a standard bar chart to the report. You can edit the chart by clicking on the cog/wheel icon. In this example, we selected a Donut chart and changed the value to Sum of Amount. We selected Show Percentages and moved the position of the legend from Right to Bottom for ease of viewing.
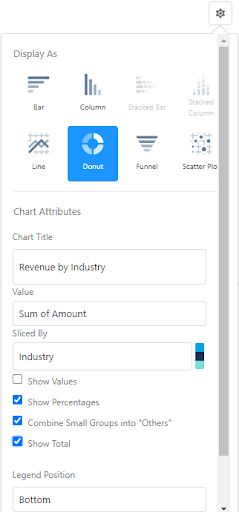
Add a descriptive title, and the chart is now complete. You can see at a glance that 66% of the upgrade pipeline is coming from customers in the energy industry.
Salesforce Classic
Setting up a Salesforce joined report in Classic follows similar steps as in Salesforce Lighting, just with a different user interface.
Initial Setup
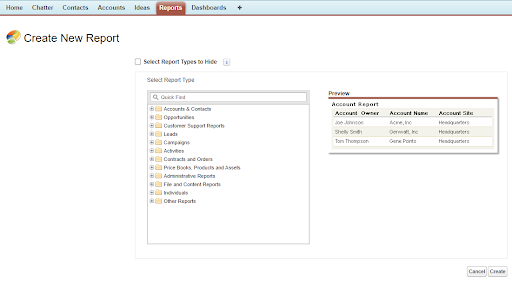
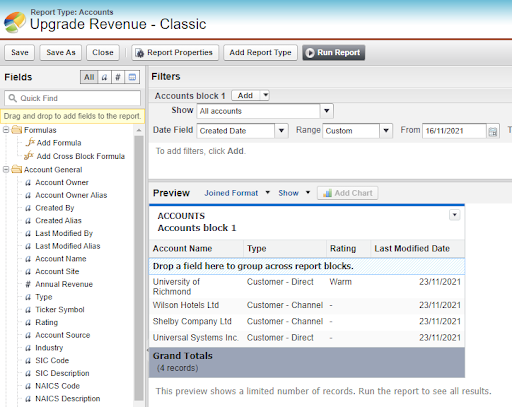
Start by navigating to the Report tab and click New Report. Search for the primary report type of Accounts.
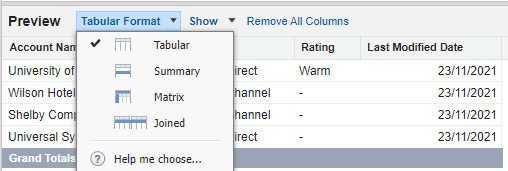
To change from a standard report to a joined report, click the arrow icon next to Tabular Format. Select Joined.
You’ll see that the button Add Report Type is no longer grayed out. Click the button to add a new Report Type.
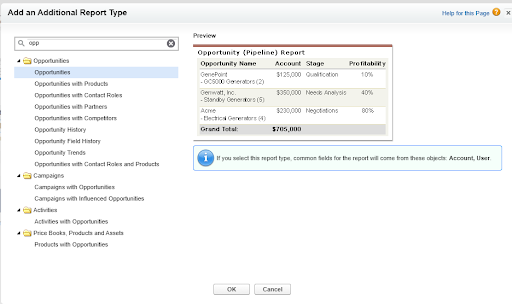
Adding Fields
Search for Opportunities from the list of report types and select it. The system will show you the objects you can pull joined report common fields from.
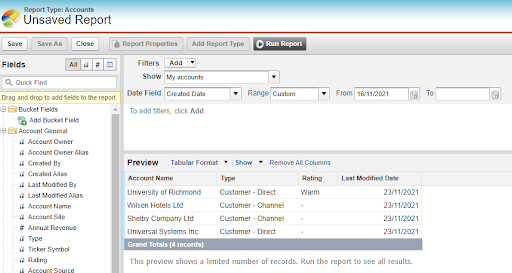
Once you’ve added both report types, change the filters to meet your requirements.
After you’ve added your filters, you can start finalizing the report. Remove the detail rows by clicking Show and then uncheck Details, as shown in the screenshot below. This removes the detail rows containing individual record information and presents the information in a summarized view.
Adding Revenue
You can also add the Amount column by searching it in the left-hand side panel, then dragging and dropping it into the Opportunity block. If you do this after removing Details, the system will ask you how to summarize the field. You can choose from Sum, Min/Max, or Average. Select Sum for this Salesforce joined reports example.
Data Visualization
You can add a chart to complete your report. Before clicking Run Report, click Add Chart. Select the Donut chart to add to your report.
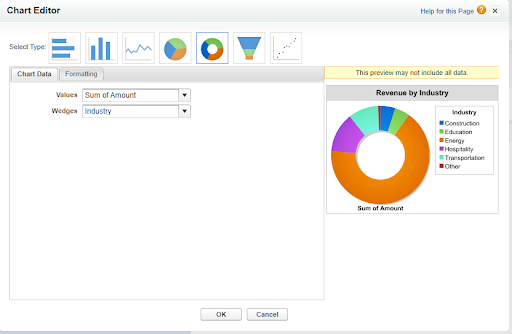
Change the Values field to Sum of Amount, then switch to the Formatting tab to add the chart title and percentages.
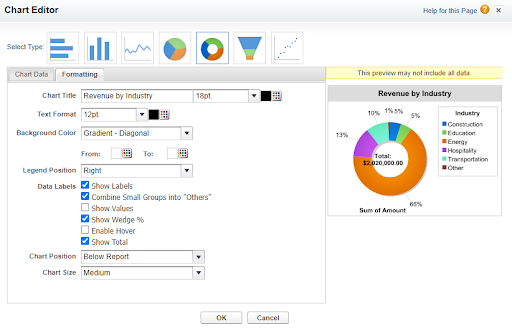
The chart will be added when you run the final report.
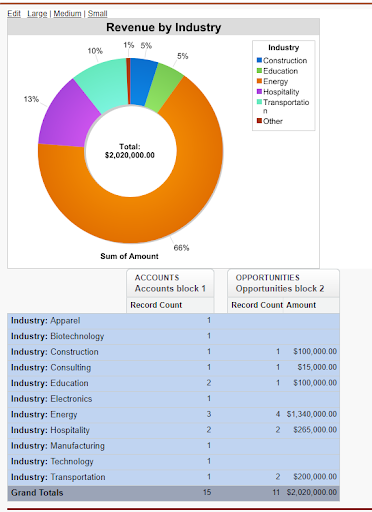
Your Classic Salesforce joined report is complete. You can add it to a new or existing joined report dashboard in Salesforce (or other dashboard).
Joined Report Best Practices
Joined reports are powerful for combining related datasets when used thoughtfully. Focus on a few aligned blocks, filter tightly, use one chart, and enrich insights with cross‑block formulas. When requirements outgrow these constraints, like exporting or cross-block filtering, explore custom report types or BI integrations.
- Keep blocks focused and filtered
- Use common groupings across blocks
- Leverage cross‑block formulas
- Clean and organize reports
- Utilize data visualizations
Accounting Seed: Reports & Dashboards
For better decisions powered by laser-focused data visibility for all stakeholders, Salesforce reports alone are not enough.
Accounting Seed is the highest-rated native Salesforce accounting software, that lets you leverage the most secure and stable API in the industry.
With Accounting Seed, you can use joined reports in Salesforce to quickly and easily cross-reference customer data, opportunity data, and accounting data. That’s a task that would otherwise require multiple systems, multiple spreadsheets, and countless hours of manual work.
By keeping sales and financial data in a single system, you can streamline reporting and gain valuable insights into your business with custom financial dashboards.
For more on how Accounting Seed can transform your Salesforce joined reports and your entire order-to-cash process, schedule a demo with the team today.
A native Salesforce accounting app, Accounting Seed, provides a full 360-degree view of your business’ performance to help you and your team make the best decisions possible. Not on Salesforce? Our software can be customized to work with any system you have through a reliable connection.
Schedule a free demo today to explore how Accounting Seed helps you manage finances your way.
See Accounting Seed in action
See how accounting on Salesforce can eliminate the need for costly integrations—and silos of mismatched information—by sharing the same database as your CRM.