Back to Blog
Do you find yourself struggling to make sense of all the data captured in your Salesforce environment? Salesforce reports and dashboards are two of the most useful out of the box features of Salesforce. Salesforce is great as a system of record, but being able to visualize and use the data in it — and draw out actionable insights — is key.
Never miss a new resource!
Newsletter sign up
"*" indicates required fields
What are Salesforce Reports & Dashboards?
The reality is that seeing and truly understanding data is essential for business sustainability. You can’t reduce expenses, maximize income, or invest resources effectively without understanding the factors driving your business. For accounting and sales, Salesforce reports and dashboards offer fast, reliable answers.
Salesforce offers a number of reports that work out of the box and without the need for additional setup, but users do have the ability to create custom report types. Making your own custom reports can offer even greater insights into your Salesforce data. We’ll dive deeper into how to set up custom report types later on.
Salesforce dashboards are a visual representation of your Salesforce reports. They give you the ability to view your key metrics in multiple ways. For example, you can have multiple dashboard components from a single report that show different information.
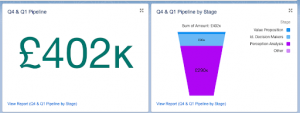
For example, the two components above use the same underlying report, but you can quickly see the total pipeline number on the left. You’ll also see a breakdown by Opportunity Stage on the right. The component on the right can let sales leadership see where Opportunities might be getting stuck in the sales process. That can help leadership create efficiencies where possible.
How do Salesforce Reports & Dashboards Work?
In a nutshell, Salesforce reports and dashboards work in any way you want. These Salesforce tools are designed to be highly user-friendly and configurable to suit individual needs. This includes how data is displayed or even unique formulas needed for specific calculations.
Salesforce reports and Salesforce dashboards present useful real time information. They’re available in both Salesforce Classic or Salesforce Lightning.
The information you can access in your reports and dashboards isn’t limited to Salesforce standard objects. Any object within Salesforce can be reported on, including those installed as part of native applications, like Accounting Seed.
For example, using the information in your Accounting Seed objects, you can create Salesforce-based dashboards surrounding your financials. Or — you can generate a management report around your current projects.
Users can also subscribe to reports to get a regular report emailed to them, or share a report in Salesforce with other users. Note that you can only view information in reports if you have access to that data through either your profile or permission set. If you can’t access Opportunities under your user permissions, you won’t be able to run or access a report on Opportunities, even if another user shares an Opportunity report with you.
Let’s look at these individual tools to see how they help you monitor and track data.
Salesforce Reports
Salesforce reports are highly configurable. Reports can serve many functions for all types of users. For example, sales users can view their account and opportunity data, while marketing users can view their lead and campaign data. Admins can run a report in Salesforce on users to monitor login history, user profiles and more.
Core features of Salesforce Reports:
- Configure easily with drag-and-drop configurations and built-in graphics.
- Group and break down report data into a document of rows and columns.
- Filter the data as required to meet your needs
- View related information across objects, such as Account data in Opportunity reports.
- Use permission settings to allow reports to be shared among selected groups or individuals.
- Export large reports to excel for further data manipulation.
Native solutions, like Accounting Seed, offer additional reporting options like financial reports alongside dynamic and standard Salesforce reports.
Salesforce Dashboards
Salesforce dashboards are also highly configurable, and dashboards are available in both Classic and Lightning. In this article we’ll cover specifics around building reports and dashboards in Lightning, but we’ve included links for the same steps in Classic.
In an ideal world, every group of users working in Salesforce would have a dashboard with their key performance indicators displayed. Dashboards can improve accountability within teams because you can see the numbers in black and white.
Core features of Salesforce Dashboards:
- Configure with drag-and-drop configurations and built-in graphics.
- Customize data and layout; allows users to add or remove display parameters.
- Display data from custom source reports.
- View real-time data instantly, automatically.
- Set the dashboard to be emailed to users automatically.
Salesforce dashboards are optimized to help to identify trends, sort out quantities, and measure the impact of relevant activities. Additionally, these dashboards let you easily isolate what’s not working to fix it. Like reports, Salesforce dashboards are easy to build, relying on simple drag-and-drop tools instead of coding to create. This lets you quickly sort and analyze data quantities thanks to their highly visible nature. Lastly, you have the option to use the same report in multiple dashboard components on a single dashboard.
Popular Types of Salesforce Reports & Dashboards
Accounts Reports
In a standard Accounts report, you might add the Account Name, Billing State, Account Type, and Industry fields to the report. You can group this relatively small amount of information in any number of ways to organize your account information. For instance, you can group by industry and filter out only prospect accounts — immediately you have a prospecting list!
Opportunity Reports
Opportunity reports are possibly the most commonly used report in Salesforce. Opportunities are the lifeblood of a customer relationship management system. Salesforce offers robust reports to extract as much insight as possible.
Sales Dashboards
The vast majority of Salesforce instances almost certainly use sales dashboards. Sales dashboards often contain similar information no matter what type of organization is using them. For example, most companies use their dashboards to see closed won opportunities for a period, open pipeline, and how far the sales organization is from its target.
Here’s a quick sales dashboard example:
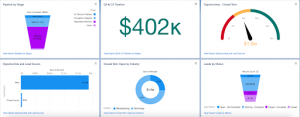
There are 6 components and immediately we can see a few key pieces of information:
- We’ve closed $1.9m of business to date, but my target is $5m.
- We’ve only got $402k worth of pipeline in the next 2 quarters. This isn’t nearly enough to reach our $5m goal.
- Our lead sources are not very diverse. The vast majority of opportunities are coming in from the website.
- The technology industry is our highest grossing industry.
- A large amount of our pipeline is stuck in negotiation status.
Based on the information in these six simple Salesforce dashboard components, we can take action right away. We can also drill down into each report to understand more about the data behind it.
Setting Up Reports & Dashboards In Lightning
Before you start creating reports and dashboards, you need to take two initial steps.
1. Define what you need to know/what you want to see.
- Determine which object(s) you want to view the data for.
- If needed, create a custom report type for the data you wish to analyze.
- Decide if you need a single report, or a full dashboard with multiple components.
2. Supplement this core question with the additional desired information.
- The date range you’d like to examine
- How you want to group the query (by product, customer, etc.).
- How you want to view the data (table, list, chart, graph, etc.).
How To Build Reports In Salesforce Lightning
Once you have the initial details nailed down, you can start creating your Salesforce reports in Lightning. The steps to create a report in Salesforce Classic can be found here.
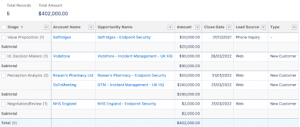
In this example, we’ll create a Sales Pipeline report. It’ll help us understand where our open Opportunities are in the sales life cycle.
- We want to view all Open Opportunities by Sales Stage.
- We want to view Opportunities for the current and next fiscal quarter.
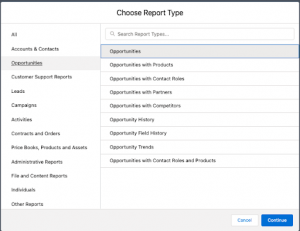
Now that you have your outline defined, start by navigating to the Salesforce reports tab and click New Report.
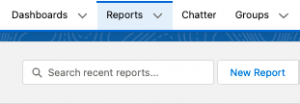
Search for the report type you want. In this example, we’ll use Opportunities. Select the report type and click Continue.
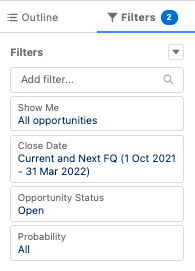
When you first open the report, it’s predefined with filters and fields. These are easily changed and we’ll cover that below.
First start by changing the filters to the ones defined above.
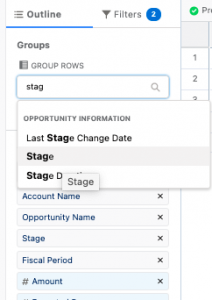
Navigate back to the Outline tab to define which fields to see in the report. Then add the Stage field in the Group section.
Next, summarize the Amount column to see the total amount of all Open Opportunities.
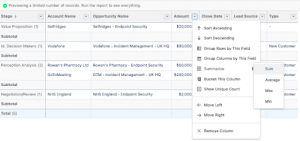
Add or remove any other fields in the Columns section and then Save & Run your report. Be sure to save the report in a public folder if you plan to share it or add it to a public Salesforce dashboard.
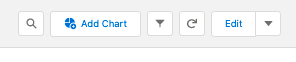
Next, you can add a chart if required. Keep in mind when creating reports in Salesforce that you can only add charts to reports that have at least one summary column. Click Add Chart.
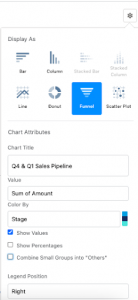
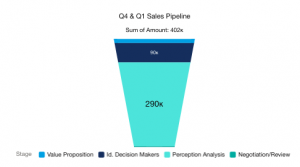
Select the chart type for your report, In this example, we’ve chosen the funnel to view, and we’ve titled the chart.
Now you can see very quickly that the vast majority of the Sales Pipeline is in the Perception Analysis stage. This insight can help you take action to ensure the Sales team is actioning those opportunities and moving them further down the sales stage, all the way to Closed Won!
Next, we’ll look at how to add this Salesforce report to a dashboard to start visualizing the data we just created.
How to Build Dashboards in Salesforce Lightning
Once you have at least one summary report or joined report, you can start creating a dashboard in Lightning. You can add a tabular report to a dashboard component, but you won’t get a summarized chart. You’ll only have access to a table component. The steps to create a dashboard in Classic are very similar.
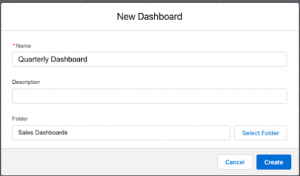
Navigate to the Dashboard tab and click New Dashboard. Title your Dashboard and put it in a folder. If you choose to keep the dashboard in your private folder, no other users will be able to access it. So if you plan to share the dashboard with other users, select an existing public folder, or create a new one. We created a new one for this exercise.
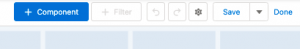
Add a new component by clicking Component.
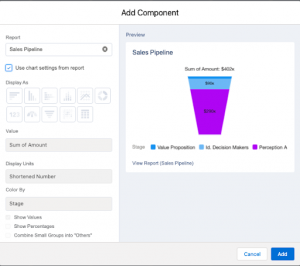
Select the report. In the example, we selected the report we built in the previous section. We decided to use the Chart settings from the report to keep things simple, but you can ignore the chart from your report and create a brand new chart specific to the dashboard. This is useful if you want to use the same report in multiple components.
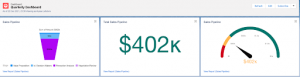
We added a few more dashboard components using the same Salesforce report. We can now see that our total pipeline is $402,000 and our target for the quarter is $2m. This is useful because we now have the insights we need to start taking action and driving more pipeline.
Users can drill down further into the reports behind each dashboard component to see the information behind the visualization. Dashboards are incredibly useful across all areas of a business to monitor business or even system activity.
You can create Reports and Dashboards for any Salesforce object, including those installed by native applications, such as Accounting Seed. For hands-on training, be sure to check out the Salesforce Trailhead full course on dashboards and reports.
Salesforce Reports and Dashboards with Accounting Seed
Accounting Seed’s Salesforce dashboards and financial reporting features let you fully visualize, monitor, and control financial health. We don’t just bring a fully automated, intuitive accounting system. We also bring the power and flexibility of the Salesforce Platform©. Here’s what customers can expect with our Salesforce accounting integration:
- Quickly access or create reports to analyze real-time business performance without managing a complex chart of accounts.
- Control how you present your data with simple Salesforce drag-and-drop functionality.
- Drill down further into a specific project, variable, period, product, and/or account.
- Make custom management reports that can be created with your own rows and columns.
Find out why our solution gives users real-time financial data instantly by signing up for a free, personalized demo today!
See Accounting Seed in action
See how accounting on Salesforce can eliminate the need for costly integrations—and silos of mismatched information—by sharing the same database as your CRM.