
Back to Blog
What is a Chart of Accounts?
To review, a chart of accounts refers to a list of organizational tags in the company’s general ledger. When designing a chart of accounts, you’re simply creating a system of data tags to classify and categorize the transactions throughout your business. The account types are divided into two categories. Balance-sheet accounts consist of asset, equity, and liability accounts, while income-statement accounts are composed of expenses and revenues.
How Does it Work?
The chart of accounts organizes your finances. In order to spend and conserve revenue effectively, companies need a way to visualize and prioritize how the money is used throughout the organization. The chart of accounts lets you do this by providing a flexible template for you to categorize your financials and understand the impact and activity of each area.
There’s no one universally right way to structure a chart of accounts. This frees each organization to develop a chart best suited for their unique needs and business model. For example, a construction company with many assets probably has sub-accounts for each asset type like vehicles and equipment to avoid overspending in each area. However, there’s an art to creating a good chart of accounts. To be effective, it needs to be precise but not overcomplicated. It’s very easy to have too many or too few accounts in your chart – most companies overstretch their chart of accounts. When this happens, your financial efficiency and accuracy can be significantly bogged down. The art behind developing a good chart of accounts begins by simply identifying your core accounting needs.
Art of the Chart
The effectiveness of a chart of accounts depends on how well you define the important financial areas of your business. Balance and flexibility are essential. You gain this balance by establishing the major categories of your company’s finances and organizing the chart based on account behavior. You remain flexible by being able to group your finances in ways that make sense without being too complicated. Start by understanding your business’ core financial needs and seeing how frequently or infrequently these finances change over time. You’ll have some accounts that act as the base of your accounting system, which seldom change, and others that will experience many variations.
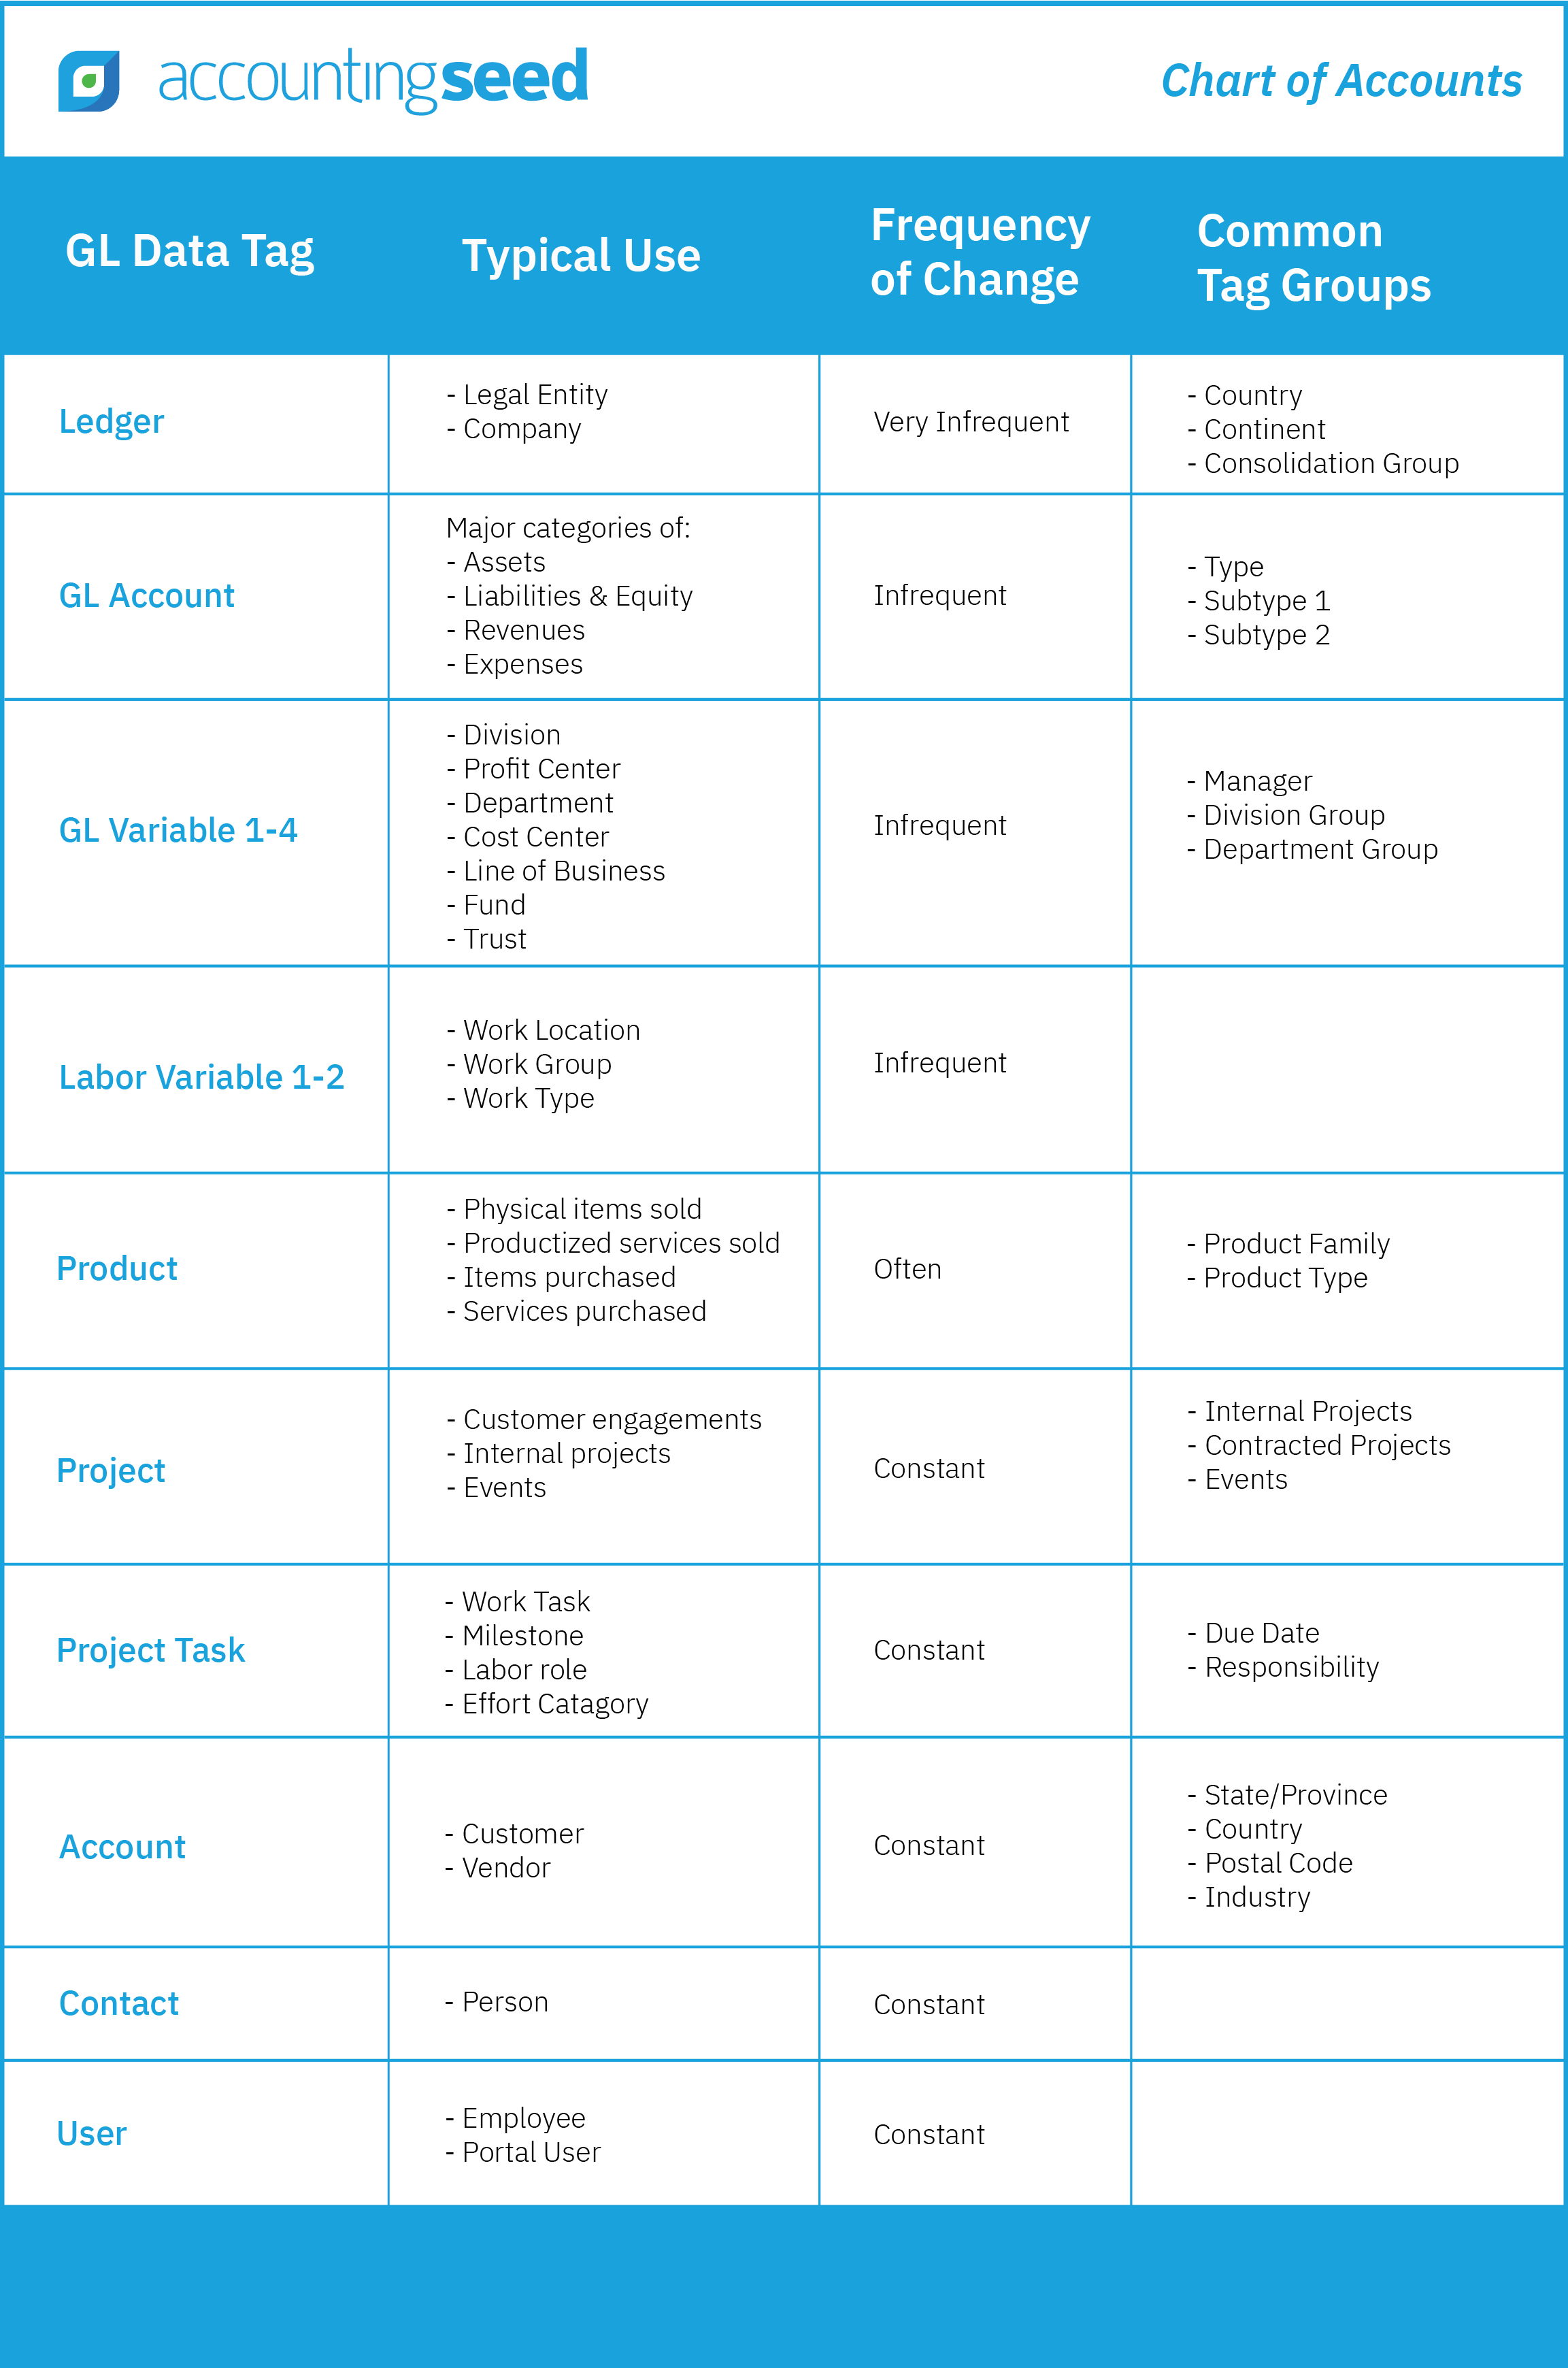
For example, your general ledger (GL) account houses your company’s major expenses and revenue; these are the core costs of running your business to achieve revenue. This won’t change often unless your business structure changes or you decide to alter business strategies dramatically. To keep the general ledger account organized, you can create a type tag for something like assets and perhaps two or more sub-accounts, or subtypes, depending on the kinds of assets your company has.
On the other hand, things like projects have so many variables that result in finances changing very frequently. Having just one account for projects is too broad and difficult to organize data. However, having too many data tags per individual project in your system is just as confusing. While each project may be unique, you may have certain budgets that are allocated to different kinds of projects. For example, common data tag groups for projects are internal projects, contracted projects (projects you perform for customers), and events. Individual project data can be grouped into its appropriate category for more concise accounting. This way you’re not forced to overstretch or minimize the chart of accounts, you can allocate and organize funds into applicable areas.
With these major categories established, you can update and add to the chart over time. This isn’t a difficult process, but the common trend is for people is to overcomplicate the way they group their financial data.
Accounting Software and Chart of Accounts
To have a balanced, flexible chart of accounts, you need options for tagging your data. Condensing your accounting transactions into a single data field makes it very difficult to manage and track precise account details. This leads to individual accounts in the chart becoming so complex that users will avoid the hassle by tracking data outside of the accounting system. This frustration is rooted in how most accounting tools generally handle the chart of accounts. Most traditional accounting systems provide only a single data field to group company finances.
Accounting Seed overcomes this limitation by allowing more flexibility in designing the chart of accounts. What are typically grouped in a single data field, Accounting Seed provides 14 data tags with an unlimited number of tag groups to categorize accounts.
This allows users to segregate and report on data in the general ledger in ways that make sense for the individual business. Customers can also create custom tags. Instead of worrying about how the chart needs to be aligned, this system lets you simply choose your major account categories and manipulate them as you need.
See Accounting Seed in action
Get a close-up view of how accounting on Salesforce can eliminate the need for costly integrations—and silos of mismatched information—by sharing the same database as your CRM.