Back to Blog
One of the most useful reporting and analysis tools are dashboards. Let’s see how Salesforce takes this platform tool to the peak of its ease-of-use and utility.
What is a Dashboard vs a Salesforce Dashboard?
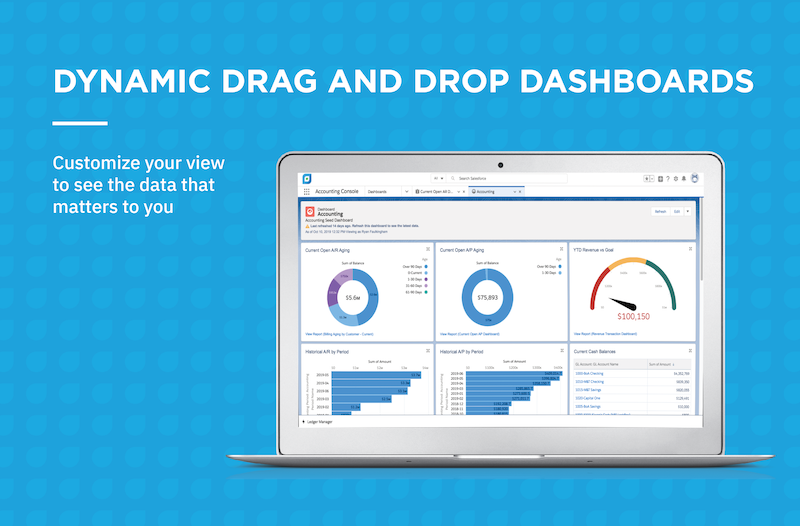
A Dashboard is a visual display of key metrics and trends for records in your organization. The relationship between a dashboard component and report is 1 to 1. This means that for each dashboard component, there is a single underlying report. Dashboards help you to understand real-time, changing business conditions on a single screen. Salesforce takes this feature to the next level through its user-friendly design. Users can create unique dashboards in just a few clicks and drill into any data they need.
Salesforce dashboards are optimized to help to identify trends, sort out quantities, and measure the impact of relevant activities. These dashboards also let you easily isolate what’s not working to fix it. Salesforce dashboards are highly customizable, helping teams quickly sort and analyze data quantities thanks to their highly visible nature. They do allow you to use the same report in multiple dashboard components on a single dashboard. This is a way to consume multiple reports that generally have the same theme, but in a single, more digestible view. This all helps your team visualize and group the data needed to make the best decisions.
Five Advantages to using the Salesforce Dashboards
Salesforce dashboards emphasize a user-friendly design and flexibility that makes it one of the most valuable resources on the platform. All native applications are equipped with these dashboards right out of the box. Whether or not individuals use the Salesforce CRM or the native application as a standalone product, they can enjoy these top five advantages.
1. Visual Data for Better Understanding
With so much information coming in daily, it becomes hard to keep track of it all. Dashboards offer a solution to this problem. Salesforce dashboards condense multiple reports into visuals, such as graphs, charts, tables, and metrics, displaying these visuals in a single interface. Dashboards allow decision-makers to review a significant amount of valuable information at just a glance.
2. Customizing Solutions to Fit Your Needs
Salesforce dashboards are totally customizable, allowing users to add or remove display parameters so that their dashboard remains 100% relevant to the needs of the business. Decision-makers can choose the data they want to see, without digging through unrelated details.
3. Real-Time Data Reporting and Analysis
Real-time reporting provides a significant advantage over batch-processing, in that there is no delay between data being received, and data being reported on. Organizations are able to act on current information, instead of having to risk using out-dated information.
4. Presenting Data
With charts, you can effectively present data. A dashboard can display data from custom source reports, has a running user to determine what data is visible, display data as of the last time the dashboard was refreshed, and show data to be scheduled to be refreshed and emailed automatically.
5. Cloud-based Analytics for Instant Deployment and Universal Accessibility
Cloud-based analytics dashboards operate directly out of the cloud, meaning fast deployment without the delays, or expense, or prolonged downtime. This greatly benefits users by reducing or even eliminating the need for extensive, complex data centers. Additionally, this makes it possible for users to connect with the programs they need and allow direct access from not just the office, but anywhere in the world.
How Do You Create A Salesforce Dashboard?
It’s super easy to set up, Salesforce dashboards allow you to build your views with a matter of clicks, no complex codes required. You can simply populate the display with the precise information you need. Check out these five easy steps to building your new dashboard below!
-
- Create your custom report.
- Before you build your dashboard, you need to create the custom report that will contain the information you want on your dashboard. Use the custom report wizard.
- Click the ‘Dashboards’ tab.
- Click ‘New Dashboard’
- Design your new dashboard.
- Drag and drop the components from the left-hand side onto the columns and enter the header name from the chart.
- Click ‘Data Sources’ to navigate to the relevant custom report and drag the report onto the chart.
- Click ‘Save’
- Once the ‘Save Dashboard’ window pops up, name the dashboard and select the folder you wish to store the dashboard to and click save.
- Click save & close and you’ll be taken back to the dashboard page to see your new dashboard!
- Create your custom report.
Now you’re all set up with your very own Salesforce dashboard.
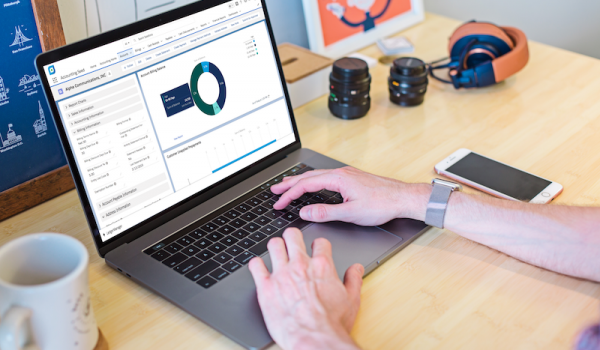
See Accounting Seed in action
Get a close-up view of how accounting on Salesforce can eliminate the need for costly integrations—and silos of mismatched information—by sharing the same database as your CRM.